Overview
The Data Visualization Dashboard built with the MERN Stack is a powerful tool designed to transform JSON data into insightful visual representations. Utilizing MongoDB for data storage and Node.js to create robust APIs, this dashboard is perfect for developers looking to visualize data effectively. With the integration of the Chart.js library, users can expect a seamless experience when creating and interacting with various data visualizations.
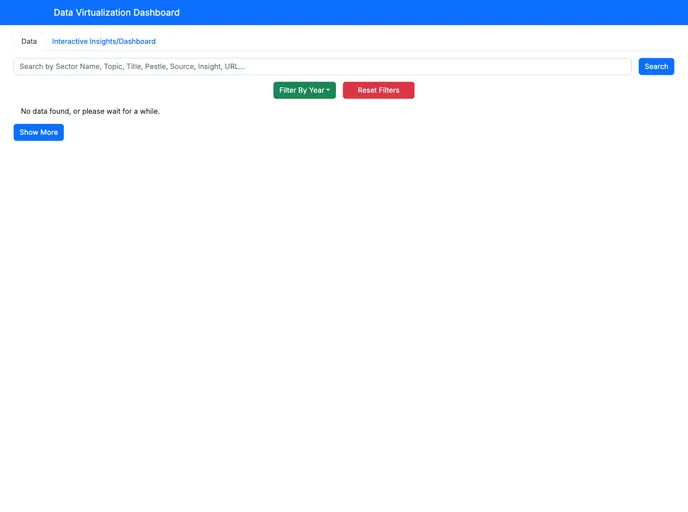
This project stands out due to its user-friendly interface and multiple filters, making it easier for users to customize their dashboard according to specific data parameters. Whether you’re analyzing trends or monitoring key performance indicators, this Data Visualization Dashboard is a versatile solution for anyone in need of clear and actionable insights.
Features
- MERN Stack Integration: Combines MongoDB, Express.js, React, and Node.js for a full-stack solution that is both scalable and efficient.
- Dynamic Visualizations: Utilizes the Chart.js library to generate a variety of charts and graphs that make data interpretation straightforward.
- API Creation: Offers a Node.js API to easily retrieve data from the MongoDB database, allowing for real-time updates and interaction.
- Custom Filters: Equipped with various filters for users to manipulate displayed data, ensuring tailored insights based on specific criteria.
- User-Friendly Interface: Designed with usability in mind, enabling users to navigate effortlessly and interact with visualizations.
- JSON Data Handling: Leverages predefined JSON data sets to streamline the data import process and promote quicker insights into information trends.
- Cross-Platform Compatibility: Accessible from multiple devices, making it easy to view and analyze data on the go.


