Overview
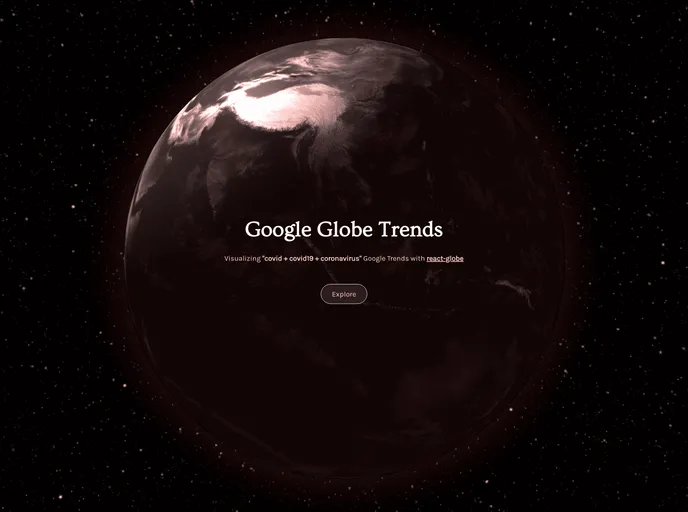
Google Globe Trends offers a unique and engaging way to visualize trends using a globe format. It’s an innovative tool that allows users to create stunning and interactive representations of data sourced from Google Trends. This software is perfect for anyone looking to present information in a visually appealing manner, whether it be for academic purposes, business presentations, or personal projects.
With its user-friendly interface, Google Globe Trends simplifies the process of transforming complex data sets into digestible visuals. The ability to manipulate and interact with the globe makes it an exciting choice for those wanting to dive deeper into the trends that shape our world.
Features
- Interactive Visualizations: Users can engage with the globe, zooming in and out to discover trends from various geographic locations easily.
- User-Friendly Interface: The intuitive design allows users of all skill levels to create visualizations without prior experience.
- Data Integration: Seamlessly pull data from Google Trends, making it straightforward to represent live and relevant information.
- Customizable Output: Adjust colors, labels, and styles to match the aesthetic needs of your project, ensuring a professional presentation.
- Real-Time Updates: Stay current with trends as the tool updates visualizations to reflect the latest data available.
- Multi-Dimensional Insights: Analyze trends based on different criteria, allowing for a multifaceted understanding of the data.
- Sharing Capabilities: Easily share your creations with others, making collaboration simple and effective.


