Overview
The @culturehq/charts is an SVG React charting library that allows users to create three basic chart types: HorizontalBarChart, PieChart, and VerticalBarChart. This library provides a simple and efficient way to generate charts using React components.
Features
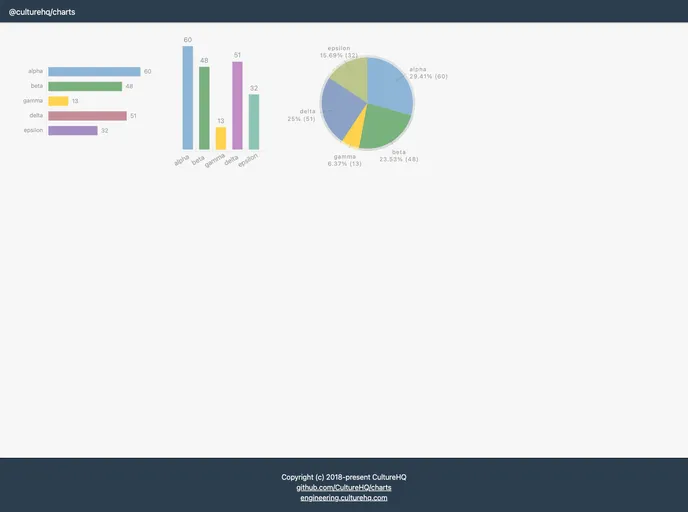
- HorizontalBarChart: A chart type that displays data in horizontal bars.
- PieChart: A chart type that displays data in a circular format, resembling a pie chart.
- VerticalBarChart: A chart type that displays data in vertical bars.
- Customizable: Each chart component accepts props such as className and data, allowing users to customize the appearance and content of the chart.
- Flexible styling: The library provides a separate style.css file that can be imported into the user’s stylesheet to apply styles to the charts.
- Testing: The library includes tests that can be run with yarn test command to ensure the functionality is working correctly.
- Linting: The code can be checked for code quality and potential issues using the yarn lint command.
- Easy contribution: Users can contribute to the library by submitting bug reports and pull requests on the GitHub repository.
Installation
To use the @culturehq/charts library, follow these steps:
- Add the library to your package.json dependencies by running the following command:
npm install @culturehq/charts --save
or
yarn add @culturehq/charts
- Import the desired chart component(s) into your React component:
import { HorizontalBarChart, PieChart, VerticalBarChart } from '@culturehq/charts';
- Use the imported chart components in your JSX:
<HorizontalBarChart className="chart" data={chartData} />
<PieChart className="chart" data={chartData} />
<VerticalBarChart className="chart" data={chartData} />
Note that the className prop is optional and can be used to apply a custom class name to the SVG element.
To apply styles to the charts, import the style.css file into your stylesheet:
@import '@culturehq/charts/dist/style.css';
Summary
The @culturehq/charts is a React library that provides users with an easy way to generate SVG charts. With three basic chart types, customizable props, and flexible styling, this library offers a convenient solution for visualizing data in web applications. Users can install the library through npm or yarn, and contribute to its development through bug reports and pull requests on GitHub.


