Overview:
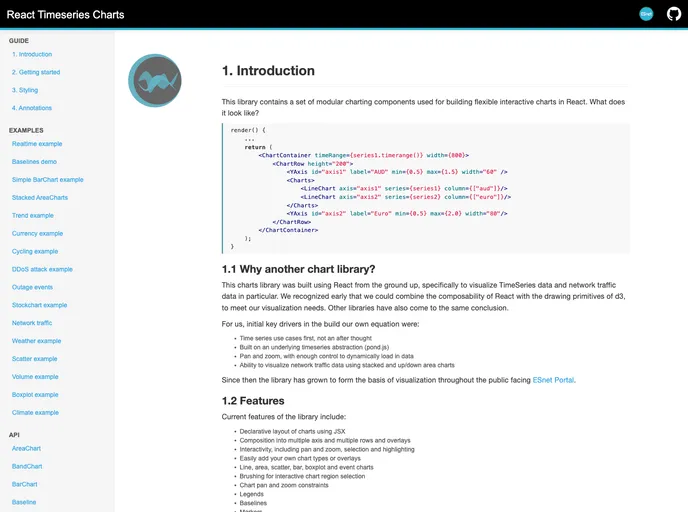
The React Timeseries Charts is a library consisting of modular charting components designed for creating interactive charts with a focus on visualizing timeseries data and network traffic data. Built specifically for React, this library combines low-level d3 elements with React’s high-level composability for flexibility in chart building.
Features:
- Declarative layout of charts using JSX
- Interactivity, including pan and zoom
- Support for adding new chart types or overlays
- Multiple axis and multiple rows for stacked or overlaid chart configurations
- Various chart types available: line, area, scatter, bar, and boxplot
- Brushing feature for selecting data ranges
- Legends to provide context for charts
- Overlay markers for highlighting specific data points
Installation:
To install the React Timeseries Charts library, you can use npm and integrate it into your project using tools like Webpack. Ensure that React and the TimeSeries abstraction library, pond.js, are present in your project. Follow these steps for installation:
Install the library using npm:
npm install react-timeseries-chartsImport necessary components in your project:
import { ChartContainer, ChartRow, Charts, YAxis, LineChart, Resizable } from "react-timeseries-charts";Construct a chart in the
render()function of your component. For example, creating a chart with two line charts:<ChartContainer timeRange={timeSeries.timerange()} width={800}> <ChartRow height="200"> <Charts> <LineChart axis="traffic" series={timeSeries} style={{/* traffic: { normal: { strokeWidth: 2 } } */}} /> <LineChart axis="volume" series={timeSeries2} style={{/* volume: { normal: { stroke: "steelblue" } } */}} /> </Charts> <YAxis id="traffic" label="Traffic" min={0} max={100} width="60" type="linear" format=",.2f" /> <YAxis id="volume" label="Volume" min={0} max={100} width="80" type="linear" format=",.2f" /> </ChartRow> </ChartContainer>
Summary:
The React Timeseries Charts library is a versatile tool for creating interactive charts with a focus on timeseries and network traffic data visualization. With features like declarative layout, interactivity, support for various chart types, and flexible stacking options, this library provides a seamless experience for developers looking to build dynamic charts in React.


