Overview
Solar UI presents an innovative and user-friendly dashboard tailored for solar panel users, allowing them to effectively manage and monitor their solar panel systems. Built using modern web technologies, this interface not only provides an aesthetically pleasing experience but also delivers comprehensive data management tools. The functionality is designed to enhance user engagement and improve understanding of solar energy dynamics, all while generating simulated data to demonstrate its capabilities.
As solar energy gains importance in our lives, having a tool like Solar UI can empower users to optimize their energy usage and management. With interactive features and responsive design, Solar UI aims to make solar energy management accessible and efficient for everyone.
Features
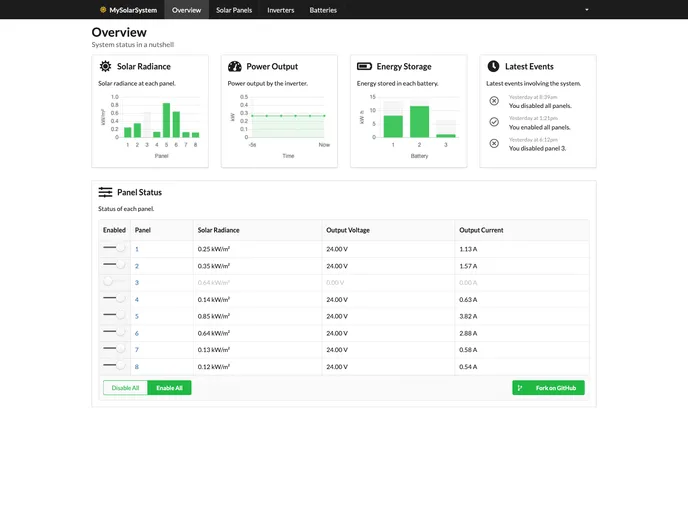
- Data Generation: Continuously generates input radiance values for solar panels using constrained random number generation, ensuring dynamic data simulation.
- Data Relationships: Outputs from individual solar panels are calculated based on their enabled status and input radiance, providing a clear insight into performance.
- Interactive Charts: Users can hover over data points on charts to receive tooltips that display detailed information, enhancing data comprehension.
- Interactive Table: A simple toggle slider allows users to enable or disable solar panels, instantly reflecting changes in the system.
- Redux DevTools Extension-Enabled: Users can utilize the Redux DevTools Extension for Google Chrome to monitor Redux actions and their contents, aiding in learning and debugging.
- Responsive Layout: The interface adapts to different screen sizes, stacking panels vertically on narrow screens for better readability.
- Mobile Menu: A convenient side navigation menu becomes available on smaller screens, ensuring easy accessibility and navigation.
- REST API Utilization: Retrieves mock user data from the Reqres REST API, showcasing the app’s capability to integrate with external data sources.


