Overview
Graphic Walker is an innovative open-source tool providing a lightweight alternative to traditional Business Intelligence platforms like Tableau. It is designed specifically for data scientists and analysts who want an easy-to-use interface for data analysis and visualization. With an intuitive drag-and-drop functionality and the ability to use natural language queries, Graphic Walker simplifies the process of exploring data and uncovering intricate patterns, making it a compelling choice for users looking for streamlined data interaction.
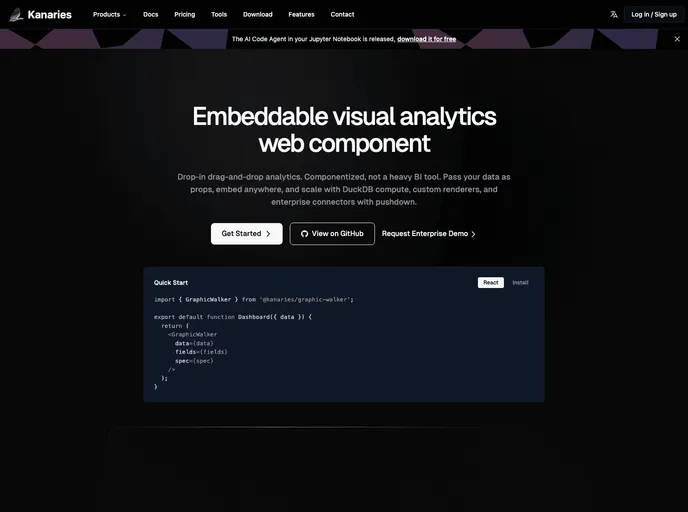
The primary focus of Graphic Walker is not to be an all-encompassing BI platform, but rather to serve as a versatile, embeddable component that can integrate effortlessly into your applications. Whether you’re developing a new project or looking for a means to enhance existing applications, this tool stands out for its straightforward integration processes and user-friendly features.
Features
- User-Friendly Interface: Enjoy a drag-and-drop approach to data analysis, making it accessible for users at any experience level.
- Data Explainer: Gain insights about patterns and the factors influencing them, similar to tools like Salesforce Einstein.
- Front-End Efficiency: Utilizes web workers for handling computations, allowing it to operate as a pure front-end application without lag.
- General Query Interface: Submit data queries to your own computational services, easily integrating with systems like DuckDB.
- Visual Themes: Switch between light and dark themes to suit your visual preferences while working on your data.
- Spatial Visualization Support: Capable of rendering spatial data with formats like GeoJSON and TopoJSON for geographic analysis.
- Natural Language Querying: Ask questions about your data in plain language, making data interaction feel like a conversation rather than complex querying.
- Dynamic Visualization Construction: Build comprehensive visualizations from the ground up using a grammar of graphics-based interface, inspired by vega-lite.
Graphic Walker combines ease of use with powerful functionalities, making it a great asset for any data-centric workflow.


