


 Github Stars:
 Last Commit:
  Created: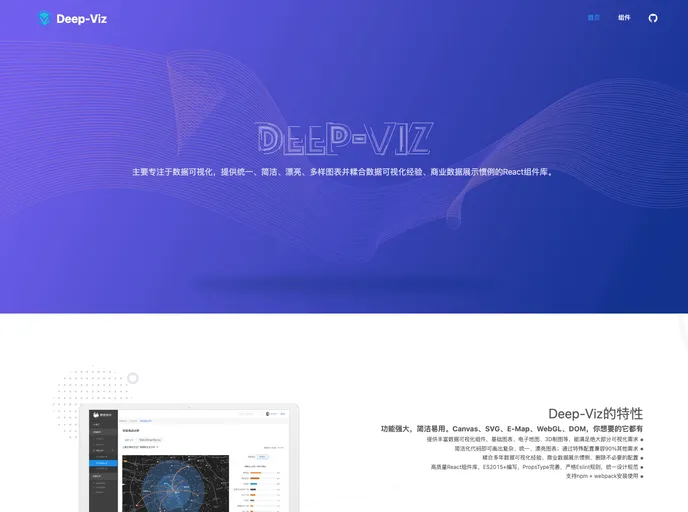
Overview:
Deep-Viz of React is a React component library that focuses on data visualization. It provides a wide range of concise and beautiful diversity charts using various technologies such as Canvas, SVG, E-map, WebGL, and Dom. The library combines data visualization experience and commercial data display practices to offer rich visual components that can meet the majority of visualization needs. It is written in ES2015 and follows strict Eslint rules. It supports npm + webpack installation and can be used in modern browsers as well as IE9 and above.
Features:
- Provides a variety of data visualization components, including basic charts, electronic maps, and 3D graphics.
- Simplified component configuration allows for the creation of complex, unified, and beautiful charts with minimal code.
- Integration of years of data visualization experience and commercial data display practices, eliminating unnecessary configurations.
- High-quality React component library with complete PropsType and a unified design specification.
- Supports npm + webpack installation and can be used in modern browsers and IE9 and above.
Installation:
The recommended way to install and use Deep-Viz of React is through npm. Here is an example of how to install and use a simple LineChart component:
- Install the library via npm:
npm install deep-viz-react
- Import the LineChart component in your React component:
import { LineChart } from 'deep-viz-react';
- Use the LineChart component in your code:
<LineChart data={data} />
- Replace
datawith the actual data you want to visualize.
For more detailed instructions and examples, refer to the official documentation at https://ludejun.github.io/deepviz/#/main/components/basic/line-chart.
Summary:
Deep-Viz of React is a powerful React component library for data visualization. With its extensive range of visual components and simplified configuration, it allows developers to create beautiful and unified charts with ease. The library is written in ES2015 and follows strict Eslint rules. It supports npm + webpack installation and can be used in modern browsers and IE9 and above. The integration of years of data visualization experience and commercial data display practices ensures high-quality components that meet the majority of visualization needs.


