Overview
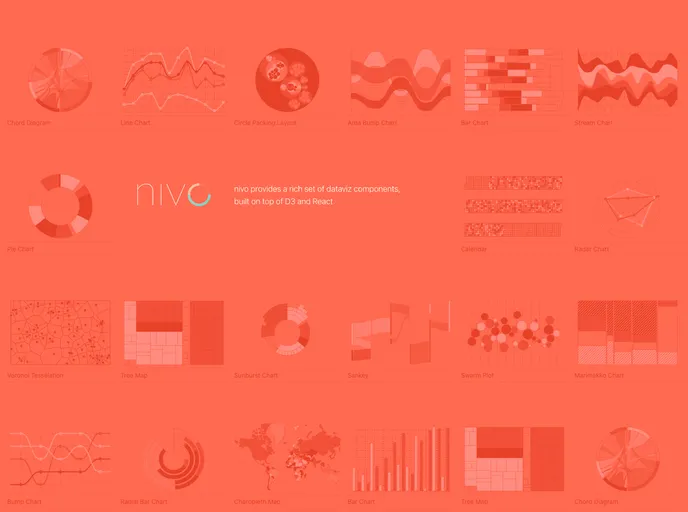
Nivo is a library that provides supercharged React components for building data visualization applications. Built on top of d3, Nivo offers server-side rendering ability and fully declarative charts, making it stand out from other React d3 integration libraries. It allows for highly customizable charts with motion/transitions, interactive components playground, exhaustive documentation, and support for SVG, HTML, and canvas charts. Nivo also provides features such as patterns & gradients, theming, and responsive charts. Additionally, there is an active Nivo community on Discord for discussions and support.
Features
- Highly Customizable: Nivo allows for customization of charts to suit specific requirements.
- Motion/Transitions: Powered by react-spring, Nivo offers smooth motion and transitions for a more engaging user experience.
- Interactive Components Playground: Nivo provides an interactive playground where users can experiment and test different components.
- Exhaustive Documentation: Nivo offers comprehensive documentation to guide developers in utilizing its features.
- SVG Charts: Nivo supports creating charts using scalable vector graphics (SVG).
- HTML Charts: Nivo also supports generating charts using HTML elements.
- Canvas Charts: Nivo provides the option to create charts using HTML canvas.
- Server Side Rendering and HTTP API: Nivo allows for server-side rendering of charts and provides an HTTP API for data fetching.
- Patterns & Gradients: Nivo includes support for patterns and gradients, enabling the creation of visually appealing charts.
- Theming: Nivo supports theming, allowing developers to customize the visual style of the charts.
- Responsive Charts: Nivo charts are responsive, automatically adapting to different screen sizes.
Installation
To use Nivo, follow these steps:
- Install the
@nivo/corepackage:
npm install @nivo/core
- Choose the specific Nivo packages according to the charts you wish to use. For example, for a line chart, install the
@nivo/linepackage:
npm install @nivo/line
Note: Repeat this step for each type of chart you want to use.
Summary
Nivo is a powerful library for building data visualization applications in React. With its extensive features, customization options, and support for different types of charts, Nivo provides developers with a flexible and convenient solution for creating visually appealing and interactive data visualizations. Its server-side rendering ability and comprehensive documentation further enhance its usability. With an active community and support available on Discord, Nivo offers a valuable resource for developers looking to incorporate data visualization into their projects.


